0%
1
2
3
| import pandas as pd
import xlwings as xw
import re,os
|
1
2
3
4
| url = "https://www.icauto.com.cn/rank/"
data = pd.read_html(url, index_col=0, header=0)[0]
data.head(10)
|
Output:
|
车型 |
资料信息 |
月销量 |
年累计 |
| # |
|
|
|
|
| 1 |
Model Y |
品牌:特斯拉,指导价:26.39-34.99万 |
41428 |
320109 |
| 2 |
秦PLUS |
品牌:比亚迪,指导价:9.98-20.99万 |
39904 |
317115 |
| 3 |
宋PLUS新能源 |
品牌:比亚迪,指导价:15.38-21.98万 |
36773 |
276140 |
| 4 |
海鸥 |
品牌:比亚迪,指导价:7.88-9.58万 |
35011 |
119828 |
| 5 |
朗逸 |
品牌:大众,指导价:9.40-15.19万 |
32105 |
246656 |
| 6 |
轩逸 |
品牌:日产,指导价:9.98-17.49万 |
30028 |
257065 |
| 7 |
元PLUS |
品牌:比亚迪,指导价:13.28-15.98万 |
28727 |
217670 |
| 8 |
AION Y |
品牌:埃安,指导价:11.96-20.26万 |
26969 |
163552 |
| 9 |
速腾 |
品牌:大众,指导价:12.79-17.29万 |
26350 |
194407 |
| 10 |
海豚 |
品牌:比亚迪,指导价:11.68-13.98万 |
24282 |
221579 |
1
2
3
4
5
6
7
8
9
10
|
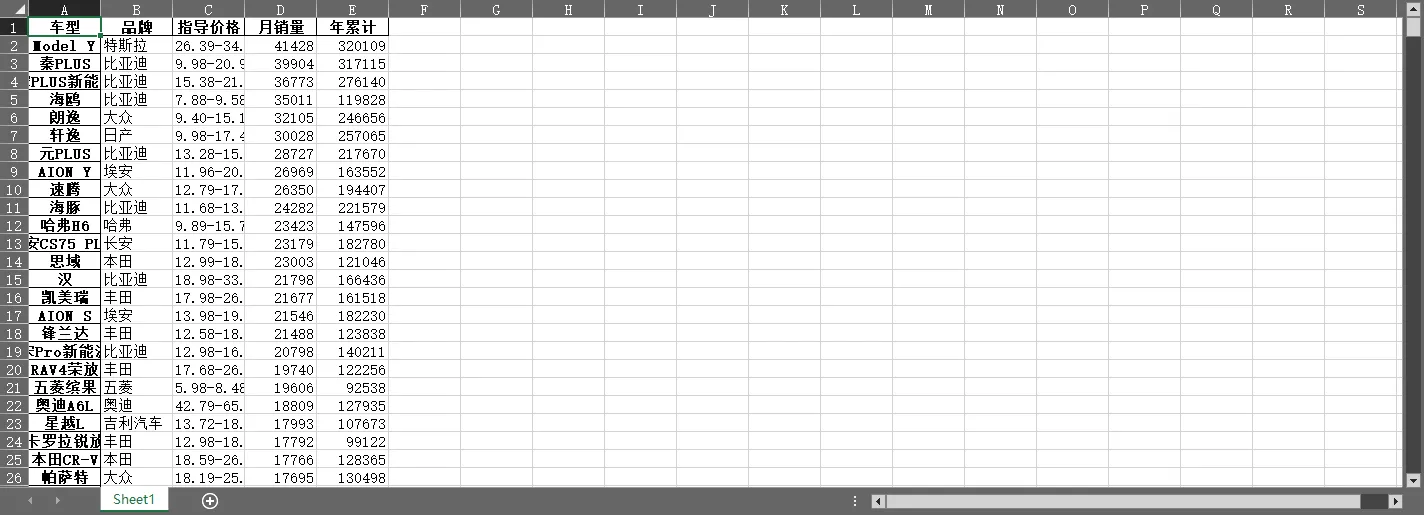
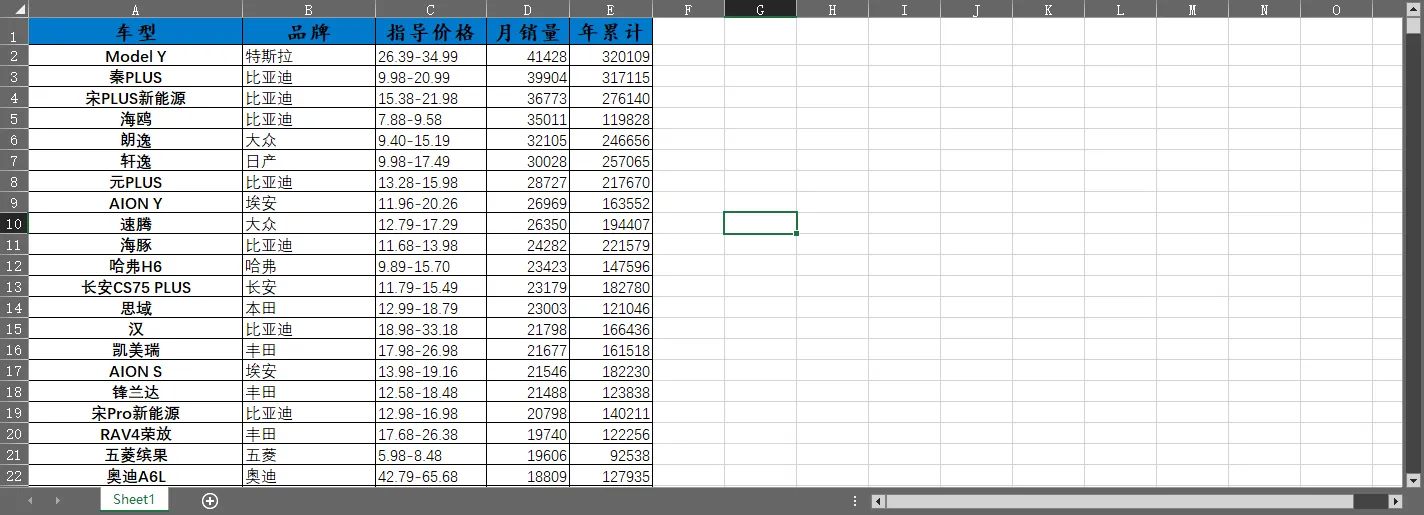
data['指导价格'] = data['资料信息'].map(lambda x :x.split(':')[-1].replace('万', ''))
data['品牌'] = data['资料信息'].map(lambda x :x.split(',')[0].split(':')[-1].replace('万', ''))
df = data.filter(['车型', '品牌', '指导价格','月销量', '年累计',])
df.set_index('车型',inplace=True)
df.to_excel('2309汽车销量统计表.xlsx')
|
Output:
1
2
3
4
5
6
7
8
9
10
11
|
app = xw.App()
wb = xw.Book('2309汽车销量统计表.xlsx')
wb.sheet_names
ws1 = wb.sheets[0]
ws1.activate()
|
Output:
[‘Sheet1’]
1
2
3
4
5
6
7
8
|
rc = ws1.used_range.shape
row = rc[0]
col = rc[1]
row
col
|
Output:
588
5
1
2
3
4
5
6
7
8
|
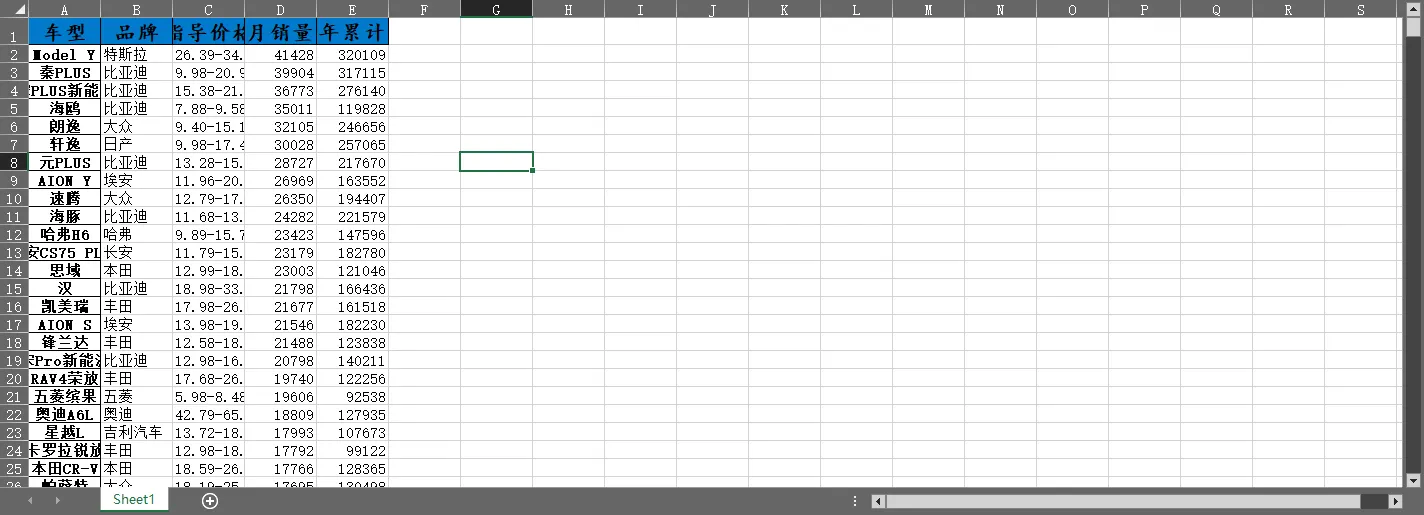
bt = ws1[0, :col]
bt.select()
bt.color = (0, 122, 204)
bt.font.name = '楷体'
bt.font.bold = True
bt.font.size = 16
|
Output:
1
2
3
4
5
|
rng1 = ws1[1:row, :col]
rng1.font.name = '等线'
rng1.font.size = 12
|
Output:
1
2
3
|
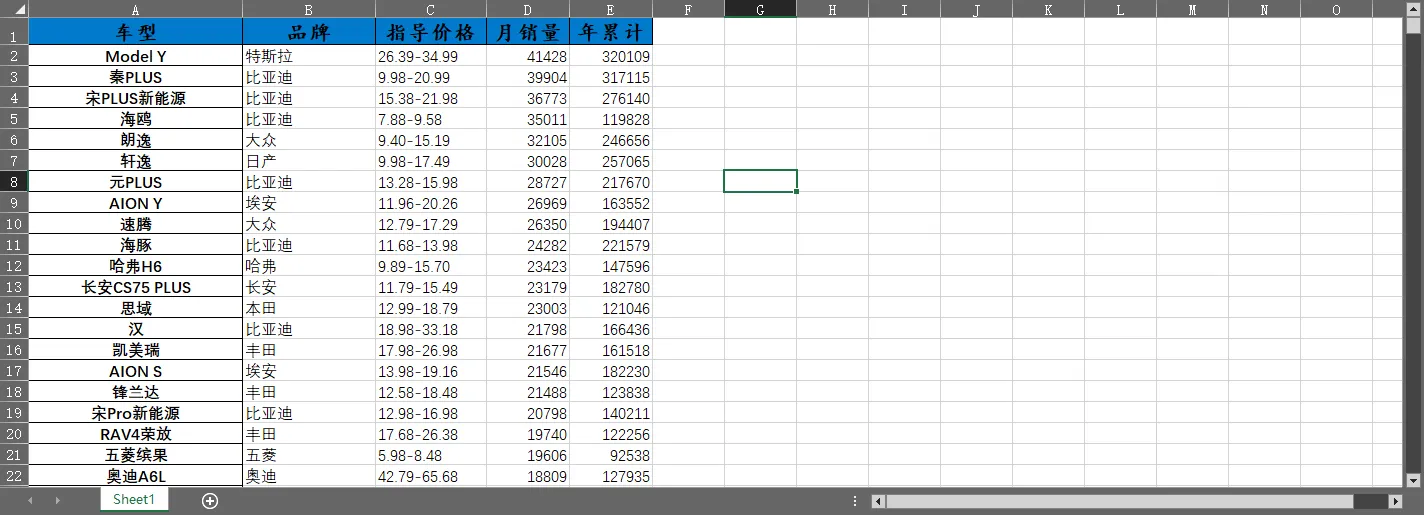
ws1[:row, :col].autofit()
|
Output:
1
2
3
4
|
ws1[:row, :col].api.Borders.LineStyle = 1
|
Output:
1
2
3
4
|
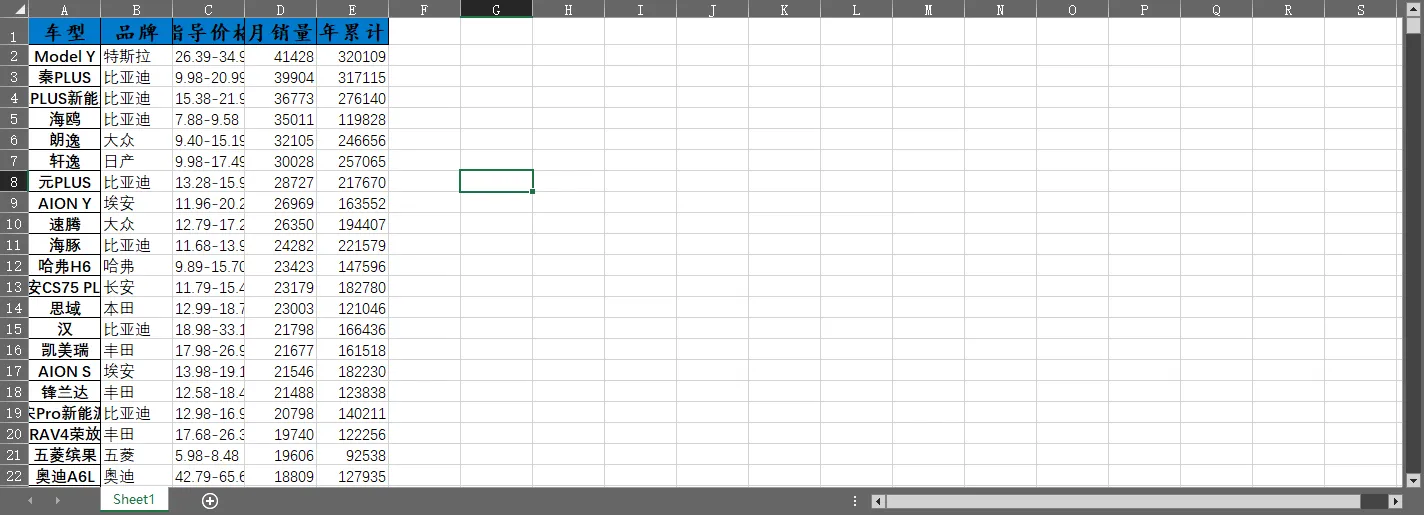
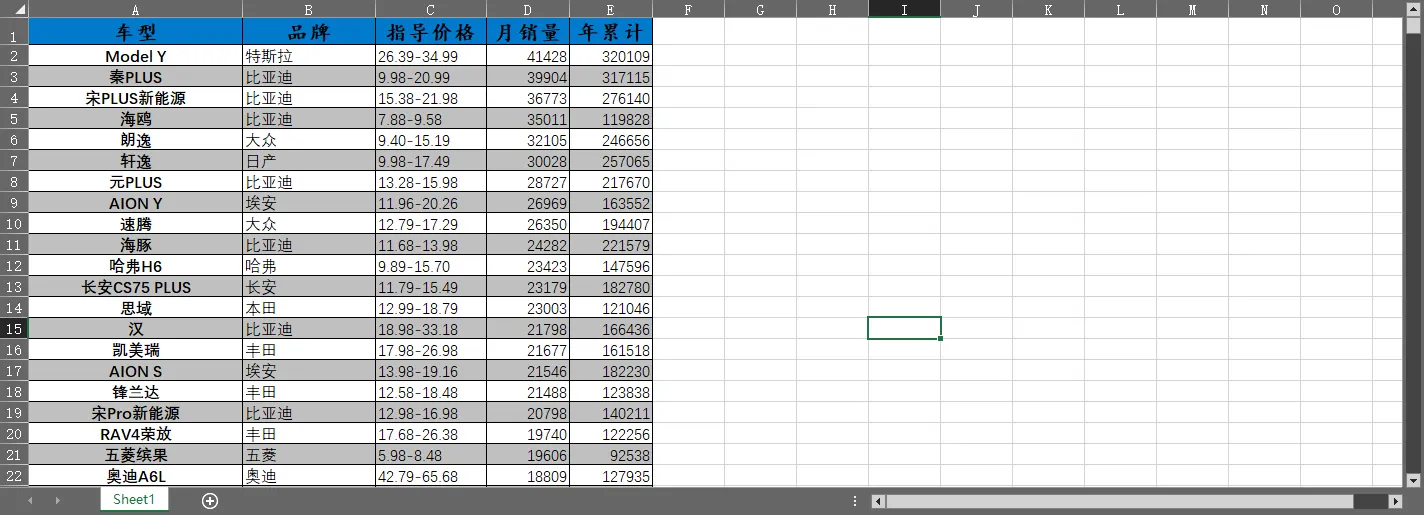
ws1[1:row, :5].api.FormatConditions.Add(
xw.constants.FormatConditionType.xlExpression,
Formula1="=Mod(Row(),2) =1").Interior.ColorIndex = 15
|
Output:
1
2
3
4
|
ws1[1:row, 6].api.FormatConditions.Add(
xw.constants.FormatConditionType.xlExpression,
Formula1="=$E2>=180000").Font.ColorIndex = 3
|

1
2
3
4
5
6
7
8
9
10
11
12
13
14
|
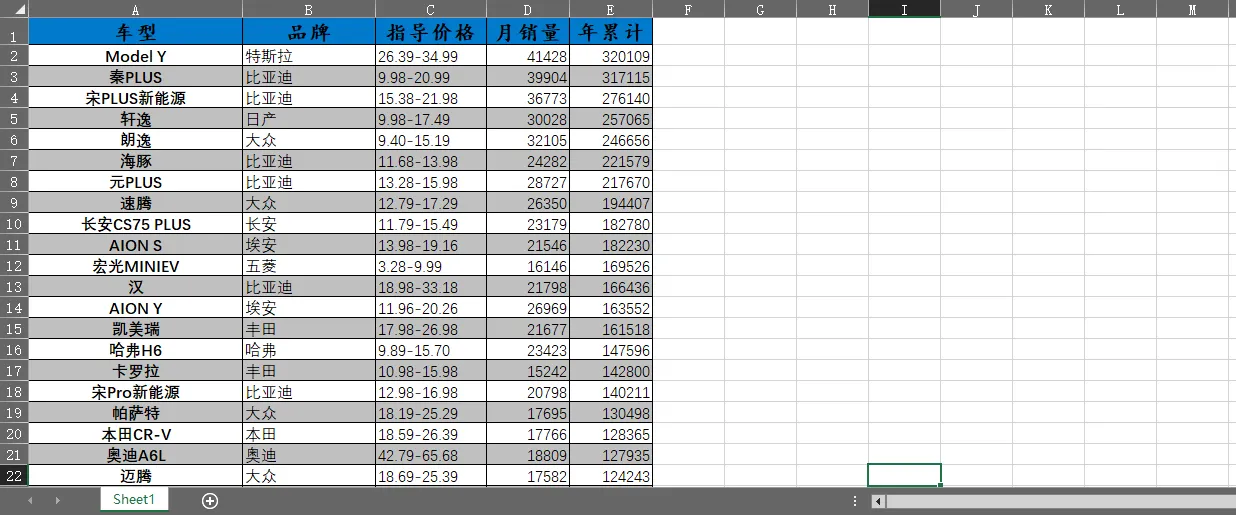
ws1[:row, :col].api.Sort(Key1=ws1[0:row, :col].api.Columns(5),
Order1=2,
Header=1,
Orientation=1)
'''
Key1=range_to_sort.api.Columns(5) 来指定按照第5列(E列)进行排序。
Order1=1 来指定升序排序 2:表示降序
Header=1 来指定第1行为表头
Orientation=1 来指定排序方向为列排序。
'''
|
True
Output:
1
2
3
4
5
6
7
8
9
10
11
12
13
|
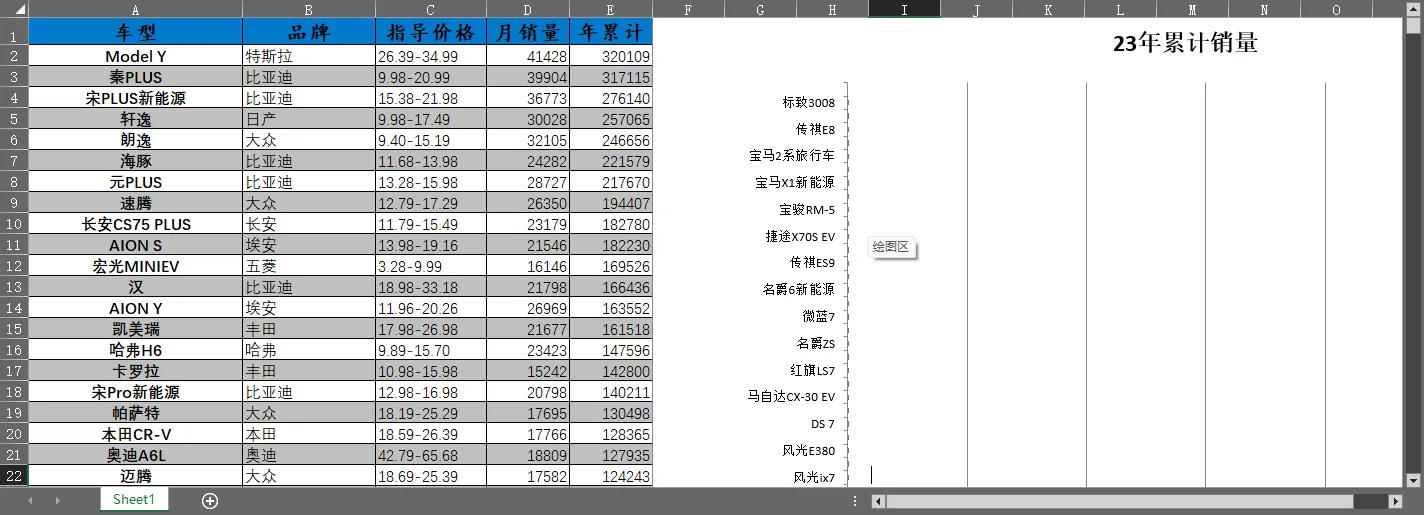
chart = ws1.charts.add(ws1[:row, :col].width, 0, 800, 6000)
chart.set_source_data(ws1.range('A:A,E:E'))
chart.chart_type = 'bar_stacked'
chart.api[1].SetElement(2)
chart.api[1].ChartTitle.Text = '23年累计销量'
chart.api[1].SetElement(302)
chart.api[1].Axes(1).AxisTitle.Text = "车型"
chart.api[1].SetElement(311)
chart.api[1].Axes(2).AxisTitle.Text = "年销量"
chart.api[1].SetElement(100)
|
1
2
3
| wb.save()
wb.close()
app.quit()
|